
Recently updated on April 15, 2024
Kibana plugin for visualization actually
Easy solution for business
5 seconds
Server metrics
Visualization of business data is very popular today, and this is pretty understandable why. Data visualization provides a lot of business advantages such as data is always in real-time – most fresh as possible, one-time cost investment which will save human resources and save from human mistakes.
Moreover, this is a big challenge to lead and develop your business without accounting. And of course, anything you do, everybody is looking for innovations to improve business processes and create cost-cutting solutions.
Probably, it could be amazing to have the universal application, intelligent machine that conducts reports on data of one’s own bat. Maybe, it would gather them from different systems to your computer, combine and compare it. And in the end, the time passes for double-checking reports, a portion of fresh data is not being used for it. Only after that business can see all sides of its’ processes.
Sounds like “This is a story about far far future and reporting became to bring a pleasure…”. So KindGeeks decided to take such a challenge and create one. As a result, we have acquired a strong expertise in this area.

Our main tool, the foundation, and bricks were Elasticsearch – an SQL database, that saves and aggregates all the information from different devices. It’s a very efficient and flexible way to prepare data for visualization. The main feature of Elasticsearch is global data analysis and answers to different user’s requests efficiently.
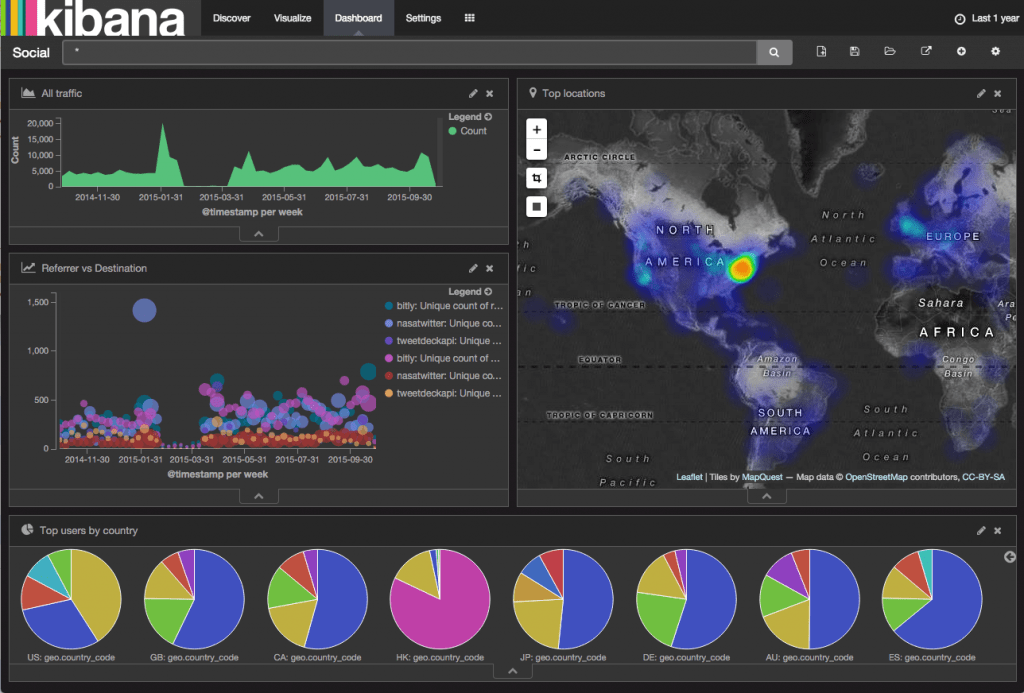
And the second part, the roof, is about using the Kibana plugin for visualization actually.
It sounds like Google analytics analog at first, but no. Those two systems complete each other and form a beautiful house.
This is a compilation of a big amount of business data from different devices (optional), an ability to chose the scope of data you need to analyze and show in a diagram, auto-synchronization.
The only Achilles’ heel is to pay attention to first set up the system to devices, but KindGeek successfully delivered to a variety of clients.
While other companies are spending thousands of dollars for data visualization per year, we found a way to make it a hundred times cheaper, easier, and reflected it on one page.
This is our systemic approach and easy solution for business.
Going deep into the tech part, one of the most common cases for analytics is log processing. We had multiple customers with such requirements. One of our customers has big web-based services, that work all across the USA which produces about 1GB of logs every day. Our aim was to gather all logs in one place and show it both in raw format and visualized with different charts.
The project intended to provide a convenient way to manage and view log data. In the end, the result log data will be accessible with Kibana dashboards, where each dashboard corresponds to a certain data source (app logs, database logs, etc.). Therefore, the dashboard contains a set of visualizations and charts, which can be created or customized with Kibana functionality. Besides a user can choose the time period for filtering logs and see raw logs as well. In addition, a user can see old logs up to one year back. However, logs older than one year are archived.
Approximate time of data delivery – 5 seconds. It means that once the log record appears in the system, it delivers to the Kibana board within 5 seconds.
We took care of all types of sources. In fact, there were: application file logs, apache2 file logs, logs from a user interface, metrics from the running server (memory, CPU, etc.)
File logs are handled with Filebeat. It tracks changes in log files and sends all new log records as soon as it appears in the file. Logs from the user interface can not be stored in a file. That’s why they are sent to our host with HTTP requests. After that, it is stored in Elasticsearch.
Also very valuable for us was the IP addresses of each request. Each address we convert to appropriate geographical coordinates and parse it on the map.
And finally, server metrics. Server metrics are gathered using Metricbeat shipper. We just configure which metric to take and where to send it.
Then we have to send data from each server to one place. In order to do this elastic beats should be installed on each application server. Each app server sends logs to the ELK server with elastic beats. Logstash parses and converts logs. After that, logs are sent to elasticsearch. Amazon Elastic Block Store is used as a volume for storing logs.
As a result, Elasticsearch, Logstash, and Kibana are installed in the single EC2 instance. Also for providing security and alerting functionality X-Pack should be installed as well.
In conclusion, there is a list of technologies we’ve used to implement this beautiful process: Elasticsearch, Logstash, Kibana, Elastic beats, Elastic X-Pack, AWS EC2, AWS EBS, AWS Glacier.
It might sound confusing, but isn’t the result beautiful now?